
If you’ve been in the data visualization community for any time at all, you’ve probably run into a conversation such as this:
Person 1 - Do not [insert nontraditional data visualization thing here, person then explains why they think that].
Person 2 - Well, it depends [continues to explain all the nuanced reasons why it depends].
A back and forth occurs, with other people chiming in periodically. Until the conversation tapers out when most come to the consensus that it does in fact depend.
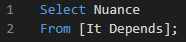
I’m well aware of how oversimplified this is, but I bet you can think of specific conversations that fit this general concept. It feels like these conversations happen everyday, and everyday I get closer and closer to building a “It Depends” database where every nuanced answer is stored ready to be queried at a moment’s notice (See below for query).
And to be clear, I find these conversations very productive. It’s important to take in and process different viewpoints from our own. It enables us to grow and shows a level of empathy that goes a long way in day-to-day interactions, and maybe - just maybe - someone might be able to change a viewpoint that you held, GASP!!
This blog will cover two conversations that have been rattling around in my head lately, both related to experimenting in data visualization. I’ll be providing my own viewpoint on each, and I hope others will do the same.
While scrolling through twitter one day I came across a conversation between two Tableau Zen Masters that really caught my attention. I found it particularly interesting due to the two participants - Andy Kriebel and Toan Hoang. Two Zen Masters that I perceive to be on opposite ends of the, what is and isn't a ‘best practice’ spectrum. I want to state that my perception of the two is based on social media consumption, and not through direct conversations. Feel free to help me adjust this.
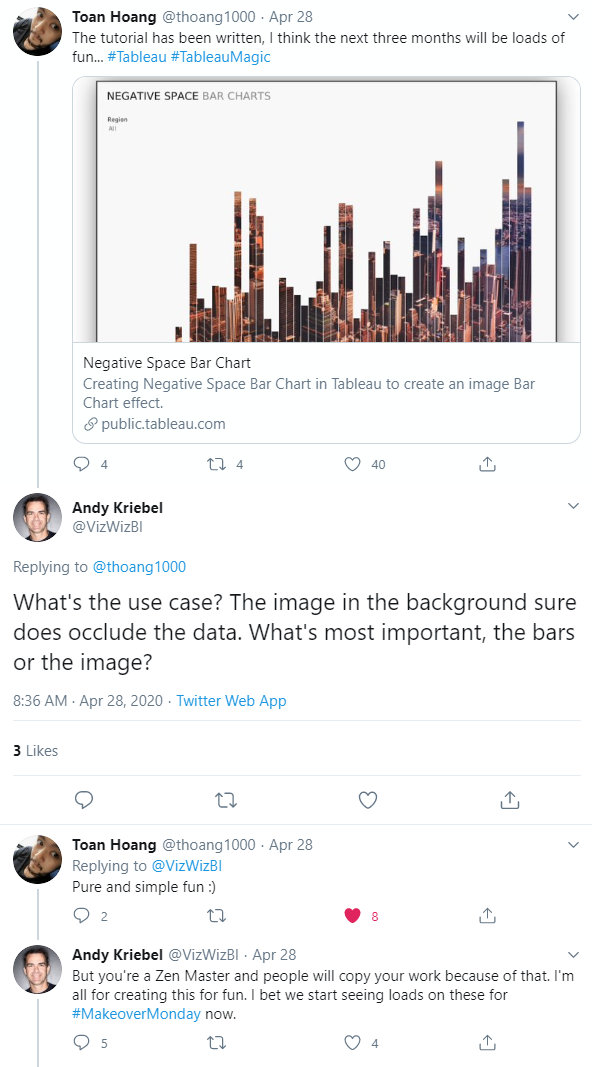
The first three tweets aren't anything new, and we see this type of conversation a lot. In fact, it's very close to the conversation I provided at the beginning of this blog. What I found most interesting was the last tweet. An idea that is not new, but pops up quite regularly in our society.
Does someone with power and recognition have the obligation to act for the benefit of society at large? You can switch society with Data Visualization Community if you’d like, but the concept is the same. Does Toan have a responsibility to create things that won’t inadvertently lead developers down a ‘non-best practice’ route? Before I provide my viewpoint, I’d like to add some context on where my opinion comes from.
I first became aware of social responsibility while listening to the Slim Shady LP and Marshall Mather LP by Eminem, years ago. If you know anything about these albums you understand how controversial and polarizing they were at the time. He said things that pushed the limits on what is to be considered free speech and sold millions doing it. Protests, lawsuits and scapegoating ensued.
There was a portion of society that believed Eminem had the obligation to set an example for the world, that due to his standing in society, it was up to him to reflect the beliefs or opinions of a certain segment of society. Because of his popularity it would surely inspire others to act out what he’s saying. Music has seen this for decades; Marilyn Manson, Black Sabbath, NWA are just a few artists that ran up against this concept. This video by Vox is a fantastic look into Art vs. Beliefs and Morals.
It’s long been my opinion that art should be true to oneself. That no entity should ever try to impose or alter someone else’s voice based on held beliefs. I do consider data visualization to be art and therefore think everyone should have the right to explore it however they see fit. That being said, a certain level of self-awareness must be present. When creating something that goes against the grain, we must recognize why it goes against it and be ready to articulate our reasoning for creating it.
So, to answer the original question. Does Toan have a responsibility to create things that won’t inadvertently lead developers down a 'non-best practice' route? No, I don’t believe he does. He has a responsibility to stay true to himself and continue creating things that inspire those in the data visualization community.
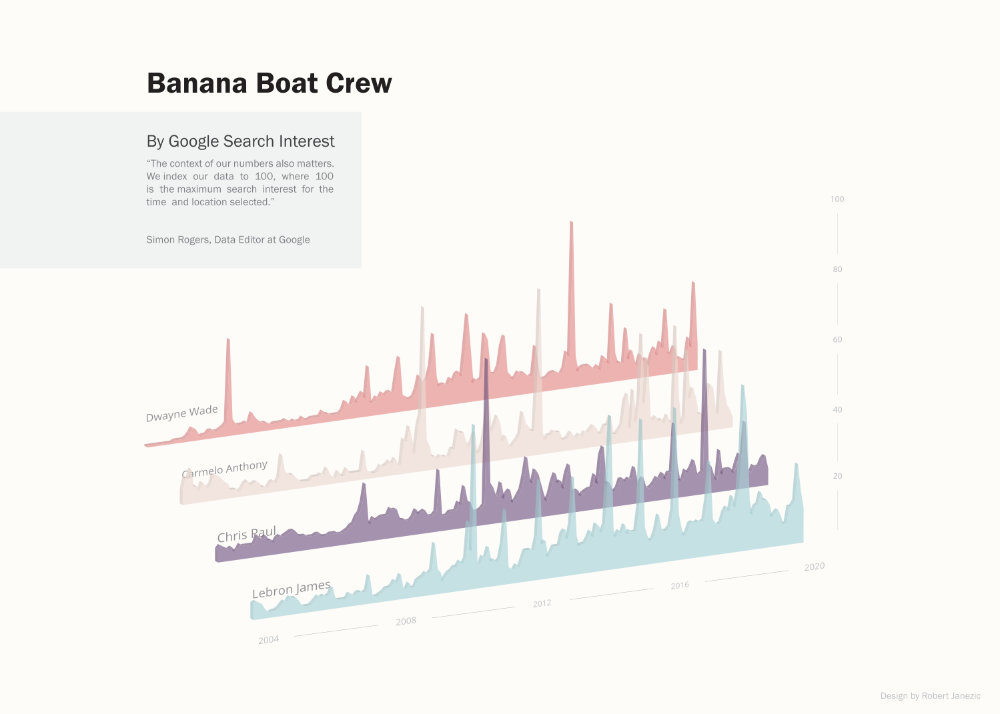
While on Youtube a few weeks ago, I came across a video that really caught my eye. It was a video that combined two of my favorite things: music and data visualization.
It wasn’t the charts or the music that caught my attention, but instead the effects added to the charts. We don't often see shadows added to charts - and for good reason. To start, an added layer of knowledge is necessary to effectively implement this type of effect. When done properly it adds a sense of realism that a flat chart will never have. But more importantly, perspective charts distort the data and may lead to erroneous inferences.
I was well aware of the best practices these charts were breaking, but all I wanted to do was create it myself.
But why?
To prove to myself that I could! I genuinely enjoy the process of not knowing how to do something, learning the skills necessary to create it, and then applying it to a project. Experimenting in data visualization is important to me specifically because it allows me to continuously grow and never get the sense that I’ve learned all I can.
Everything I just mentioned is selfish in nature and does not consider the direct implications it may have on the data visualization community. But like I mentioned before, I believe that creators have a responsibility to stay true to themselves. You could however make the argument that creating “experimental” visualizations and layouts will inspire others to think outside of the box. A concept that I continuously try to promote to anyone creating things.
If you go through my Tableau Public portfolio it’s no secret that I enjoy an unusual aesthetic at times. Which is no surprise for me personally because I’ve always enjoyed music, movies and TV that are the antithesis of the mainstream. So naturally, it bleeds over into my personal projects.
As someone that likes to create these types of projects, I’ve thought a lot about this section’s proposed question, and I imagine that others who create these types of visuals have, as well. So I decided to reach out to those who dabble in the “experimental” realm of data visualization (Tableau, specifically). Below are some of the responses for the proposed question.
Why is experimenting in data visualization important?
If data visualization is an art and science, both fields benefit greatly from experimentation. It is how the fields grow and evolve. Art especially is constantly evolving and seeking new ways to connect with an ever-changing society. Data visualization is ultimately about the audience and how they consume information. Our field should evolve to reflect that. And an important part of evolving is experimenting in new and sometimes controversial ways. The 'rules' of data visualization are actually best practices and are not written in stone. They are generally based on human perception and that is not universally true and infinite. So to restrict our field to bar charts good, pie charts bad is both limiting and inaccurate. - Adam E McCann
Data Visualization increases engagement with data, whether it be to find insights quicker, or to highlight points of interest. Data Visualization is human centric, and as no two humans are the same, to be able to deliver to a wider spectrum, we need more tools in the toolbox, and that is why experimenting is extremely important. - Toan Hoang
Often we talk about experimentation as 'versus best practice', but best practices rarely take anything into account beyond precision or accuracy. If those two things are your only goals, best practice may suffice. But, we're often trying to deliver other kinds of impact, too: surprise, excitement, curiosity, or even joy, sadness, or anger. Our current standards and best practices haven't been tried and tested for these things, and that's where we need experimentation. A bar chart may be immediately intuitive and help a user accurately identify the biggest category; but a radial diagram may better convey a cyclical or central perspective metaphor, while engaging the user with something more novel. That's not to say experimentation is always better — but in the truest sense of the word, we play with new ideas, test them, and then we discard what doesn't work. - Joshua Smith
Experimentation is important because it's the best and quickest way to learn. Without experimenting you might not ever come across that brilliant solution you never knew you were so close to. It's also a great way of learning what not to do. If you try five different ways of visualizing your data, it might be the experimentation process that tells you that the Sankey/Donut/bump chart you used that was just right last time really isn't the most appropriate choice this time. But also it's the best way to learn new techniques. Stretch out of your comfort zone to experiment with an alternative, and you can learn a whole new skill or a whole new best practice understanding. Even if the experiment results in something you don't use, you might have learned the perfect solution for the next project just round the corner ...That's why Tableau is great because you can undergo that experimentation process so quickly. It's not uncommon for the final visualization to be created on 'Sheet23', or whatever! - Neil Richards
Short answer is what I call the Giorgio Moroder model which goes right back to this quote: 'Once you want to free your mind about a concept of harmony and music being correct, you can do whatever you want. So nobody told me what to do and there was no preconception of what to do.' Discovery is spontaneous. It’s not planned. It’s chaos blending with curiosity; a hole begging to be filled with someone willing to try wood when there’s no dirt; or a 5 year old who looks to the sky for a ladder to the moon. I did this post along time ago where you'll find those quotes. But will also add, how we're using data today is still fairly young. As people get more exposed to how we present data, we can mature and expand those methods. We have to discover, to explore, and yes, even do off the wall things to get to the answer. I've done it numerous times where a certain visual worked for me, but I needed a different register for others. But that super-experimental chart got me to understand and from there I translated into a different method. That's just one reason, but it's one I commonly rely on (and it'd done wonders on for clients). - Bridget Cogley
Experimenting is important because people need to have a basic understanding of how the world works in order to be emancipated, but you can’t make it an imposition, you need to speak a language that everyone understands. This language is data visualization. Seeing not only lets many of us believe but understand and perform critical analysis as well.This language changes in time as people do, and you have to try new stuff in order to chase this change. - Kovacs Ivett
I believe that experimenting within Data Visualization or within a given tool helps us to grow as a community and to grow as individuals. Without experimentation, we may not have all the great resources, tools, and even chart types that we come to rely upon. When Matt Chambers first introduced the US Hex Map, he was met with a lot of resistance. But has since become one of the most common charts we utilize. That said, we must be careful in our approach. When introducing new techniques, charts, etc., we must be mindful that people will emulate our work. We must be careful to provide good rational and reasoning as to when a new chart or technique might be used. And we need to admit when they simply should never be used. I tend to do this in much of my work. I've even created flashing warnings on visualizations to alert readers of potential pitfalls. - Kevin Flerlage
Experiments are one of the ways to confirm or reject hypotheses and thus gain new insights. This applies to research or science in general, and of course also to the field of data visualization or our specific way of using and bending Tableau. Where do the hypotheses come from? Most of us, of course, do not deal with the topic of data visualization scientifically, but rather practically or out of pure enthusiasm. So we make the hypotheses ourselves ('I could try that.' 'That would be cool.') or are approached by our clients ('I think a 3D pie chart would work well here.'). Whenever we set out to test one of these hypotheses, we experiment and gain new insights. At least for us or our clients. Sometimes these insights are also of interest to the wider Tableau community, rarely some of them even find their way into the product. But it's always fun. - Klaus Schulte
Experimentation is what pushes the boundaries, what challenges the art of the possible and for many of us is what inspires us. Without experimentation would we be creating so many amazing and creative solutions in Tableau? I doubt it. We are only as good as our limitations, and experimentation helps expand our horizons and challenges the status quo. That said, for me, experimentation has a time and a place. Being experimental in your work place is entirely different to being experimental in your personal vizzes. Personal vizzes are a representation of us as individuals, our creative outlet. Work is our place to meet a requirement and deliver value. Experimentation has to exist in the workplace but it has to drive value, driven by enhancing user experience and maximizing insights. I doubt my end users would ever have asked for Apple style alarm bell notifications, but when we delivered them, inspired by Kevin Flerlage and Hesham Eissa, boy did they love it! This was workplace experimentation in action and it was awesome. I recognize experimentation isn’t for everyone and that’s just fine. We can all benefit from it, by recreating someone’s experimental approach, by downloading their Tableau public viz, we put our own creative spin on it. You don’t have to be the inventor to experiment, you just have to be willing to open your mind and embrace the potential to be inspired by others. - Simon Beaumont
The data visualization nowadays pays more and more attention. Our world generates a lot of data and the volume of data increases drastically. The huge problem the people can’t realize and understand the data because the majority of people never dealt with huge amount of data. But it has to learn how to manage the data and understand it. I think experimenting with data visualization allows you to feel the data. Of course we can use classic charts like bar charts and line graphs, and it will work good for plenty business cases. Actually we shouldn’t associate the data visualization with only for the business cases. There are new directions of the data visualization are increasing: data journalism and data art for instance. Every year the number of submissions for “the information is beautiful awards” go up, new approaches and awesome vizzes appear every day. Experimenting with data visualization helps users learn their BI or other tools and adds creativity to their vizzes. Sharing our vizzes and receiving feedback from other people can extend our knowledge, analyzing what works well and what doesn’t. As in any fundamental science the experiments may be unsuccessful but we get new knowledge anyway. Pushing boundaries, visualization communities forms new vectors of development, and I believe the vendors of viz tools are watching over new ideas in data visualization and continuously improve their products to be on a cutting edge. So experimenting with data and dataviz, we push each other to find new ways in the data viz, extending our knowledge and inventing new approaches in data visualization to feel the data better. - Alex Varlamov
I began to experiment in Data Visualization with Tableau a few years back. By that time, I knew about some rules existing in our field but was eager to break them to learn more about the way Tableau works. At the end, the journey was far more interesting, because the more I broke the rules, the more I understood them. From my point of view, experimenting helped me to get better in my field. If I had to sum up my thoughts: Know the rules. Understand the rules. Break the rules. Understand the rules better. Create our own new rules. From a general perspective, I really think experimentation helps a field or language to survive. Every living language, way to communicate or science evolves and changes. If not, they can fear extinction as the world around changes too. Of course not every experiment in Data Visualization is a success, but from time to time some may improve the way we visualize data and communicate insights. Now that I think about it, even Nature experiments and the things that evolves are more about to survive in a changing habitat. Hum, food for thought! - Ludovic Tavernier


